Serious writing for
serious readers
My 20 minute talk to the students of the Oxford University Conservative Association summarised the progress the Conservative Party is making attracting Muslim voters.
Summary
Delivered 7 February 2017. Posted 13 February 2017.
On 7 February 2017, I gave a talk to the Oxford University Conservative Association. I recorded it so the 20 minute talk can be listened to below.
Underneath the talk I have posted links to various items I refer to during the talk, and some demographic data regarding British Muslims.
Advertisement
Click image

My first presentation recording was done on the spur of the moment, just putting my iPhone 6 on the table and relying on its built in microphone. See my page Lecture: One Muslim’s Perspective on Religious Freedom.
Once I found recording presentations worthwhile, I purchased a high quality Sennheiser digital lapel microphone which plugs into my iPhone 6. That produces a much better recording.
Milton Friedman's TV series "Free to Choose" on YouTube.
The Conservative Muslim Forum's website.
The ethnic make up of Britain's Muslims, as shown in 2011 census.
| Religion | Muslim |
| All categories: Ethnic group | 2,706,066 |
| White: Total | 210,620 |
| White: English/Welsh/Scottish/Northern Irish/British | 77,272 |
| White: Irish | 1,914 |
| White: Gypsy or Irish Traveller | 378 |
| White: Other White | 131,056 |
| Mixed/multiple ethnic group: Total | 102,582 |
| Mixed/multiple ethnic group: White and Black Caribbean | 5,384 |
| Mixed/multiple ethnic group: White and Black African | 15,681 |
| Mixed/multiple ethnic group: White and Asian | 49,689 |
| Mixed/multiple ethnic group: Other Mixed | 31,828 |
| Asian/Asian British: Total | 1,830,560 |
| Asian/Asian British: Indian | 197,161 |
| Asian/Asian British: Pakistani | 1,028,459 |
| Asian/Asian British: Bangladeshi | 402,428 |
| Asian/Asian British: Chinese | 8,027 |
| Asian/Asian British: Other Asian | 194,485 |
| Black/African/Caribbean/Black British: Total | 272,015 |
| Black/African/Caribbean/Black British: African | 207,201 |
| Black/African/Caribbean/Black British: Caribbean | 7,345 |
| Black/African/Caribbean/Black British: Other Black | 57,469 |
| Other ethnic group: Total | 290,289 |
| Other ethnic group: Arab | 178,195 |
| Other ethnic group: Any other ethnic group | 112,094 |
British Muslims as a percentage of the population, by age group.
| Muslims as % of total age group | |
| Entire population | 4.8% |
| Age 0 to 4 | 9.1% |
| Age 5 to 7 | 9.2% |
| Age 8 to 9 | 8.9% |
| Age 10 to 14 | 7.5% |
| Age 15 | 6.8% |
| Age 16 to 17 | 6.4% |
| Age 18 to 19 | 6.0% |
| Age 20 to 24 | 6.3% |
| Age 25 to 29 | 7.1% |
| Age 30 to 34 | 7.3% |
| Age 35 to 39 | 6.1% |
| Age 40 to 44 | 4.4% |
| Age 45 to 49 | 2.9% |
| Age 50 to 54 | 2.7% |
| Age 55 to 59 | 2.4% |
| Age 60 to 64 | 1.4% |
| Age 65 to 69 | 1.3% |
| Age 70 to 74 | 1.5% |
| Age 75 to 79 | 1.3% |
| Age 80 to 84 | 0.8% |
| Age 85 and over | 0.4% |
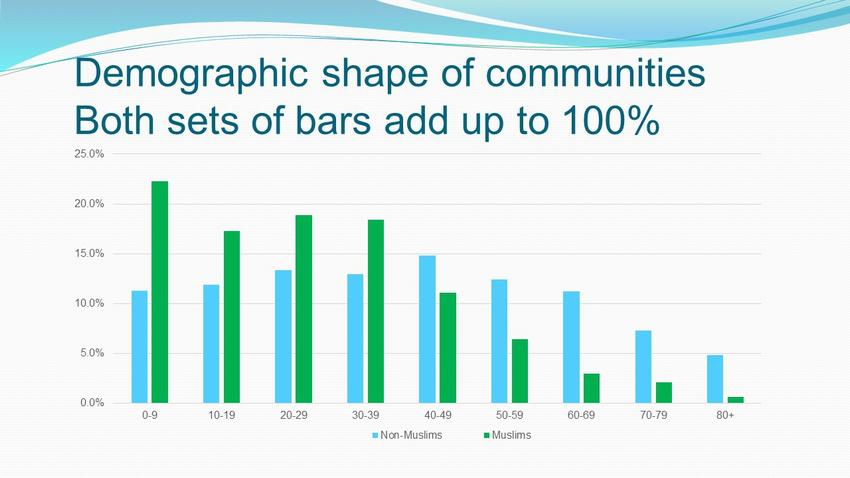
The demographic shape of the Muslim and non-Muslim populations of England & Wales. Both sets of bars add up to 100%. Their relative heights show the shape of the two populations.
Advertisement
Click image

Muslims by constituency on the Conservative Muslim Forum website
"Degrees of Separation – Ethnic minority voters and the Conservative Party" by Lord Ashcroft
"The Conservative Party, racial equality and national identity" - my book chapter for Demos.
My article "The Conservative Party's need to exorcise Enoch Powell's ghost"
My article "UK political party differences in selecting BME Parliamentary candidates"
Follow @Mohammed_Amin

